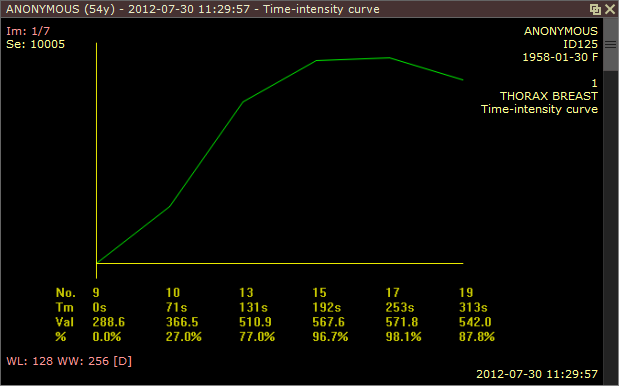
时间强度曲线工具可让您通过在对比剂施用后随时间绘制信号强度值来可视化病变的增强行为(例如,在乳房MRI中)。
绘制时间强度曲线
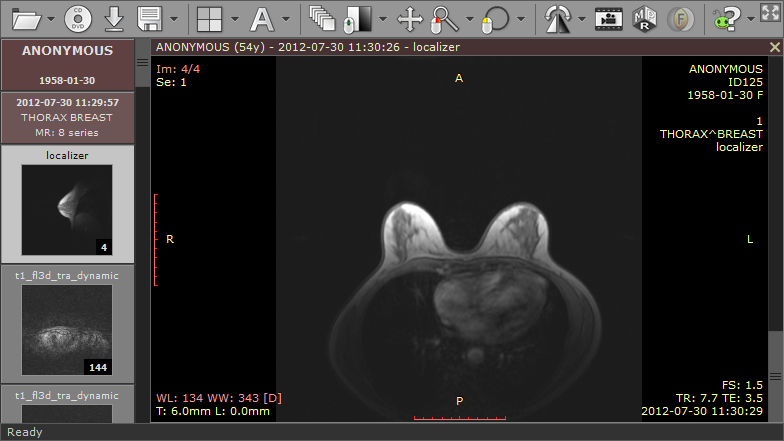
1)打开带有动态序列的算例。
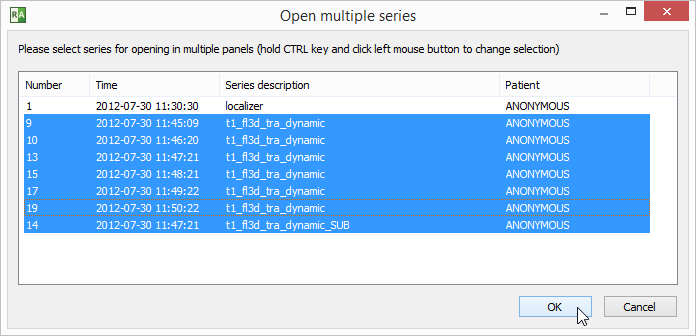
2)按 F4 键显示“打开多个系列”窗口,选择动态系列(包括未增强的系列)。启用减法的系列也将很方便地快速定位病变。
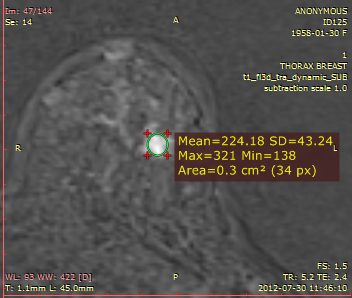
3)找到您要分析的病变并在其上绘制一个椭圆。
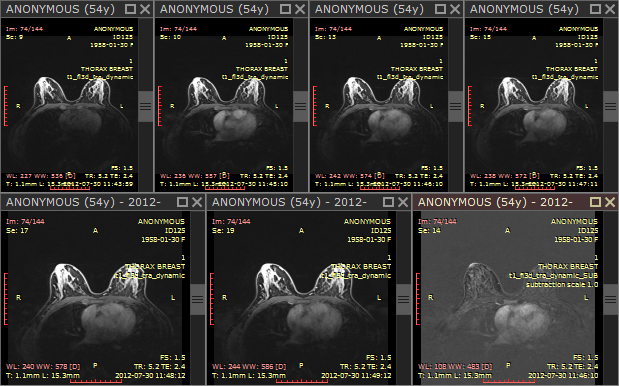
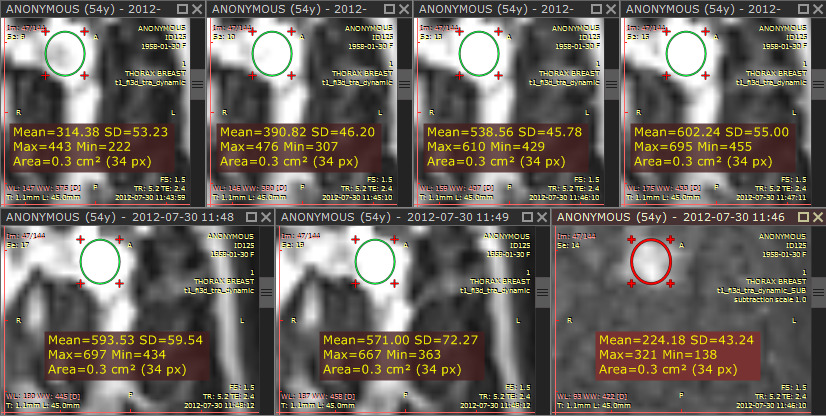
4)使用 Ctrl + Shift + D 快捷键,可以将椭圆ROI快速复制到其他系列中。
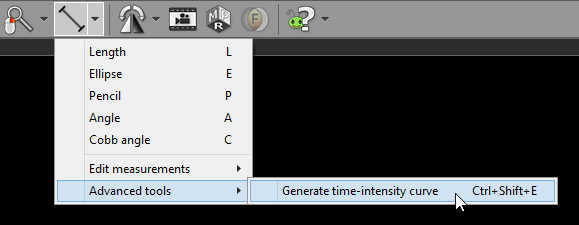
5)选择 时间-强度曲线 从 高级工具 或使用 按Ctrl + Shift + E 。
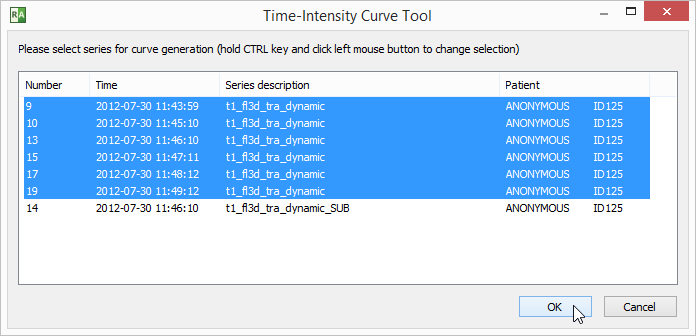
6)RadiAnt DICOM Viewer自动选择用于生成曲线的系列。
如果要使用其他系列,请更改选择。单击 确定 确认选择并生成曲线。
7)将添加一个新面板。它包含时间强度曲线和动态序列中用于计算的区域的屏幕截图。
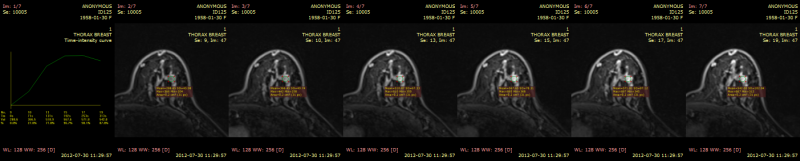
8)最大化面板(双击它)以查看详细的曲线。